Página de pruebas 3

From Sinfronteras
Revision as of 22:47, 3 July 2020 by Adelo Vieira (talk | contribs)
Jump to: navigation, search


Regression Error:

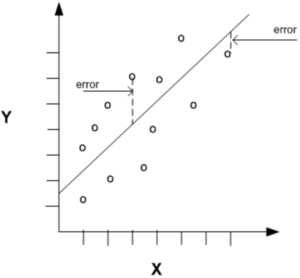
The evaluation of regression models involves calculation on the errors (also known as residuals or innovations).

Errors are the differences between the predicted values, represented as and the actual values, denoted .

Regression errors.png
5 6 1
6.5 5.5 1
8 9.5 1.5
8 6 2
7.5 10 2.5
Mean Absolute Error - MAE
The Mean Absolute Error (MAE) is calculated taking the sum of the absolute differences between the actual and predicted values (i.e. the errors with the sign removed) and multiplying it by the reciprocal of the number of observations.

Note that the value returned by the equation is dependent on the range of the values in the dependent variable. it ks scale dependent.

MAE is preferred by many as the evaluation metric of choice as it gives equal weight to all errors, irrespective of their magnitude.


Mean Squared Error - MSE

The Mean Squared Error (MSE) is very similar to the MAE, except that it is calculated taking the sum of the squared differences between the actual and predicted values and multiplying it by the reciprocal of the number of observations. Note that squaring the differences also removes their sign.


As with MAE, the value returned by the equation is dependent on the range of the values in the dependent variable. It is scale dependent.


Root Mean Squared Error

The Root Mean Squared Error (MSE) is basically the same as MSE, except that it is calculated taking the square root of sum of the squared differences between the actual and predicted values and multiplying it by the reciprocal of the number of observations.


As with MAE and MSE, the value returned by the equation is dependent on the range of the values in the dependent variable. It is scale dependent.


MSE and its related metric, RMSE, have been both criticized because they both give heavier weight to larger magnitude errors (outliers). However, this property may be desirable in some circumstances, where large magnitude errors are undesirable, even in small numbers.


Mean Absolute Percentage Error

Mean Absolute Percentage Error (MAPE) is a scale-independent measure of the performance of a regression model. It is calculated by summing the absolute value of the difference between the actual value and the predicted value, divided by the actual value. This is then multiplied by the reciprocal of the number of observations. This is then multiplied by 100 to obtain a percentage.


Although it offers a scale-independent measure, MAPE is not without problems:

  • It can not be employed if any of the actual values are true zero, as this would result in a division by zero error.
  • Where predicted values frequently exceed the actual values, the percentage error can exceed 100%
  • It penalizes negative errors more than positive errors, meaning that models that routinely predict below the actual values will have a higher MAPE.


R squared

, or the Coefficient of Determination, is the ratio of the amount of variance explained by a model and the total amount of variance in the dependent variable and is the rage [0,1].


Values close to 1 indicate that a model will be better at predicting the dependent variable.


R squared is calculated by summing up the squared differences between the predicted values and the actual values (the top part of the equation) and dividing that by the squared deviation of the actual values from their mean (the bottom part of the equation). The resulting value is then subtracted from 1.


A high is not necessarily an indicator of a good model, as it could be the result of overfitting.