Difference between revisions of "Página de pruebas 3"
Adelo Vieira (talk | contribs) |
Adelo Vieira (talk | contribs) |
||
| Line 10: | Line 10: | ||
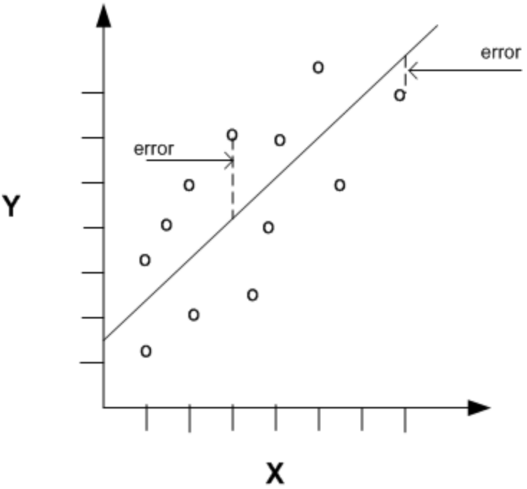
Errors are the differences between the predicted values, represented as <math>\hat{y}</math> and the actual values, denoted <math>y</math>. | Errors are the differences between the predicted values, represented as <math>\hat{y}</math> and the actual values, denoted <math>y</math>. | ||
| − | <div style=" | + | <div style="width: 200px; height: 20px; margin: 0 auto;"> |
{| | {| | ||
![[File:Regression_errors.png|300px|center|link=Special:FilePath/Regression_errors.png]] | ![[File:Regression_errors.png|300px|center|link=Special:FilePath/Regression_errors.png]] | ||
Revision as of 23:00, 3 July 2020
|
Regression Error The evaluation of regression models involves calculation on the errors (also known as residuals or innovations). Errors are the differences between the predicted values, represented as and the actual values, denoted .
| ||||||||||||||||||||||
|---|---|---|---|---|---|---|---|---|---|---|---|---|---|---|---|---|---|---|---|---|---|---|
ContentsMean Absolute Error - MAE |
The Mean Absolute Error (MAE) is calculated taking the sum of the absolute differences between the actual and predicted values (i.e. the errors with the sign removed) and multiplying it by the reciprocal of the number of observations.
Note that the value returned by the equation is dependent on the range of the values in the dependent variable. it ks scale dependent. MAE is preferred by many as the evaluation metric of choice as it gives equal weight to all errors, irrespective of their magnitude. |
| ||||||||||||||||||||
Mean Squared Error - MSE |
The Mean Squared Error (MSE) is very similar to the MAE, except that it is calculated taking the sum of the squared differences between the actual and predicted values and multiplying it by the reciprocal of the number of observations. Note that squaring the differences also removes their sign.
|
| ||||||||||||||||||||
Root Mean Squared Error |
The Root Mean Squared Error (MSE) is basically the same as MSE, except that it is calculated taking the square root of sum of the squared differences between the actual and predicted values and multiplying it by the reciprocal of the number of observations.
|
| ||||||||||||||||||||
Mean Absolute Percentage Error |
Mean Absolute Percentage Error (MAPE) is a scale-independent measure of the performance of a regression model. It is calculated by summing the absolute value of the difference between the actual value and the predicted value, divided by the actual value. This is then multiplied by the reciprocal of the number of observations. This is then multiplied by 100 to obtain a percentage.
|
| ||||||||||||||||||||
R squared |
, or the Coefficient of Determination, is the ratio of the amount of variance explained by a model and the total amount of variance in the dependent variable and is the rage [0,1].
|
| ||||||||||||||||||||