Difference between revisions of "Data Science"
Adelo Vieira (talk | contribs) (→Artificial neural network) |
Adelo Vieira (talk | contribs) (→What is Data Science - Data Analytics - Data Analysis - Data Mining - AI - Machine Learning) |
||
| Line 43: | Line 43: | ||
<br /> | <br /> | ||
| − | ==What is Data Science - Data Analytics - Data Analysis - Data Mining - AI - Machine Learning== | + | ==What is Data Science - Data Analytics - Predictive Data Analytics - Data Analysis - Data Mining - AI - Machine Learning== |
| − | |||
| − | |||
| − | |||
| − | |||
| − | |||
| − | |||
| − | |||
| − | |||
| − | |||
| − | |||
| − | |||
| − | |||
| − | |||
| − | |||
| − | |||
Data analysis is the process of inspecting, cleansing, transforming, and modeling data with a goal of discovering useful information, suggesting conclusions, and supporting decision-making. | Data analysis is the process of inspecting, cleansing, transforming, and modeling data with a goal of discovering useful information, suggesting conclusions, and supporting decision-making. | ||
Revision as of 22:42, 9 July 2020
- Media:Exploration_of_the_Darts_dataset_using_statistics.pdf
- Media:Exploration_of_the_Darts_datase_using_statistics.zip
Contents
- 1 Data Science and Machine Learning Courses
- 2 What is Data Science - Data Analytics - Predictive Data Analytics - Data Analysis - Data Mining - AI - Machine Learning
- 3 Mathematics and Statistics for Data Science
- 4 Types of Machine Learning
- 5 Data Mining - Machine Learning Algorithms
- 6 Python for Data Science
- 7 R
- 8 RapidMiner
Data Science and Machine Learning Courses
- Posts
- Udemy: https://www.udemy.com/
- Python for Data Science and Machine Learning Bootcamp - Nivel básico
- Machine Learning, Data Science and Deep Learning with Python - Nivel básico - Parecido al anterior
- Data Science: Supervised Machine Learning in Python - Nivel más alto
- Mathematical Foundation For Machine Learning and AI
- The Data Science Course 2019: Complete Data Science Bootcamp
- Coursera - By Stanford University
- Udacity: https://eu.udacity.com/
- Columbia University - COURSE FEES USD 1,400
What is Data Science - Data Analytics - Predictive Data Analytics - Data Analysis - Data Mining - AI - Machine Learning
Data analysis is the process of inspecting, cleansing, transforming, and modeling data with a goal of discovering useful information, suggesting conclusions, and supporting decision-making.
Data mining is a particular data analysis technique that focuses on the modeling and knowledge discovery for predictive rather than purely descriptive purposes, while business intelligence covers data analysis that relies heavily on aggregation, focusing on business information.
Data mining is the process of discovering patterns in large data sets involving methods at the intersection of machine learning, statistics, and database systems.[1] Data mining is an interdisciplinary subfield of computer science and statistics with an overall goal to extract information (with intelligent methods) from a data set and transform the information into a comprehensible structure for further use. https://en.wikipedia.org/wiki/Data_mining
What’s the Difference Between Data Analytics and Data Analysis: https://www.getsmarter.com/blog/career-advice/difference-data-analytics-data-analysis/#:~:text=Data%20analysis%20and%20data%20analytics,data%20analysis%20is%20a%20subcomponent.
Al tratar de encontrar una definición para Machine Learning me di cuanta de que muchos expertos coinciden en que no hay una definición standard para ML.
En este post se explica bien la definición de ML: https://machinelearningmastery.com/what-is-machine-learning/
Estos vídeos también son excelentes para entender what ML is:
- https://www.youtube.com/watch?v=f_uwKZIAeM0
- https://www.youtube.com/watch?v=ukzFI9rgwfU
- https://www.youtube.com/watch?v=WXHM_i-fgGo
- https://www.coursera.org/lecture/machine-learning/what-is-machine-learning-Ujm7v
Una de las definiciones más citadas es la definición de Tom Mitchell. This author provides in his book Machine Learning a definition in the opening line of the preface:
Tom Mitchell
The field of machine learning is concerned with the question of how to construct computer programs that automatically improve with experience.
So, in short we can say that ML is about write computer programs that improve themselves.
Tom Mitchell also provides a more complex and formal definition:
Tom Mitchell
A computer program is said to learn from experience E with respect to some class of tasks T and performance measure P, if its performance at tasks in T, as measured by P, improves with experience E.
Don't let the definition of terms scare you off, this is a very useful formalism. It could be used as a design tool to help us think clearly about:
- E: What data to collect.
- T: What decisions the software needs to make.
- P: How we will evaluate its results.
Suppose your email program watches which emails you do or do not mark as spam, and based on that learns how to better filter spam. In this case: https://www.coursera.org/lecture/machine-learning/what-is-machine-learning-Ujm7v
- E: Watching you label emails as spam or not spam.
- T: Classifying emails as spam or not spam.
- P: The number (or fraction) of emails correctly classified as spam/not spam.
Mathematics and Statistics for Data Science
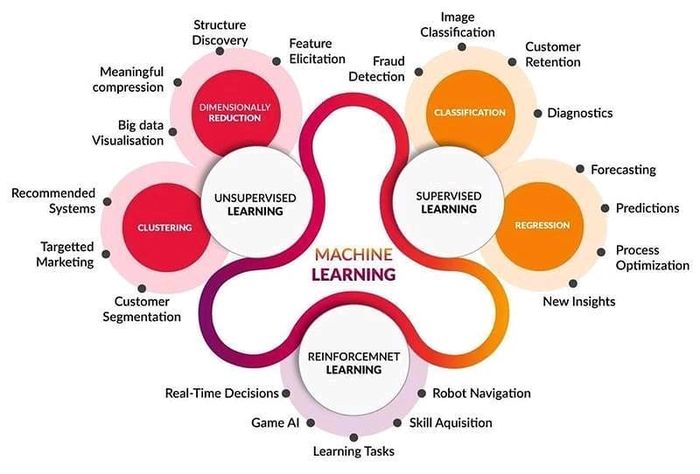
Types of Machine Learning
Supervised Learning
https://en.wikipedia.org/wiki/Supervised_learning
- Supervised learning is the machine learning task of learning a function that maps an input to an output based on example input-output pairs.
- In another words, it infers a function from labeled training data consisting of a set of training examples.
- In supervised learning, each example is a pair consisting of an input object (typically a vector) and a desired output value (also called the supervisory signal).
A supervised learning algorithm analyzes the training data and produces an inferred function, which can be used for mapping new examples.
https://machinelearningmastery.com/supervised-and-unsupervised-machine-learning-algorithms/
The majority of practical machine learning uses supervised learning.
Supervised learning is when you have input variables (x) and an output variable (Y) and you use an algorithm to learn the mapping function from the input to the output.
Y = f(X)
The goal is to approximate the mapping function so well that when you have new input data (x) that you can predict the output variables (Y) for that data.
It is called supervised learning because the process of an algorithm learning from the training dataset can be thought of as a teacher supervising the learning process. We know the correct answers, the algorithm iteratively makes predictions on the training data and is corrected by the teacher. Learning stops when the algorithm achieves an acceptable level of performance.
https://www.datascience.com/blog/supervised-and-unsupervised-machine-learning-algorithms
Supervised machine learning is the more commonly used between the two. It includes such algorithms as linear and logistic regression, multi-class classification, and support vector machines. Supervised learning is so named because the data scientist acts as a guide to teach the algorithm what conclusions it should come up with. It’s similar to the way a child might learn arithmetic from a teacher. Supervised learning requires that the algorithm’s possible outputs are already known and that the data used to train the algorithm is already labeled with correct answers. For example, a classification algorithm will learn to identify animals after being trained on a dataset of images that are properly labeled with the species of the animal and some identifying characteristics.
Unsupervised Learning
Reinforcement Learning
Data Mining - Machine Learning Algorithms
Boosting
Gradient boosting
https://medium.com/mlreview/gradient-boosting-from-scratch-1e317ae4587d
https://freakonometrics.hypotheses.org/tag/gradient-boosting
https://en.wikipedia.org/wiki/Gradient_boosting
http://arogozhnikov.github.io/2016/06/24/gradient_boosting_explained.html
Boosting is a machine learning ensemble meta-algorithm for primarily reducing bias, and also variance in supervised learning, and a family of machine learning algorithms that convert weak learners to strong ones. Boosting is based on the question posed by Kearns and Valiant (1988, 1989): "Can a set of weak learners create a single strong learner?" A weak learner is defined to be a classifier that is only slightly correlated with the true classification (it can label examples better than random guessing). In contrast, a strong learner is a classifier that is arbitrarily well-correlated with the true classification. https://en.wikipedia.org/wiki/Gradient_boosting
Gradient boosting is a machine learning technique for regression and classification problems, which produces a prediction model in the form of an ensemble of weak prediction models, typically decision trees. It builds the model in a stage-wise fashion like other boosting methods do, and it generalizes them by allowing optimization of an arbitrary differentiable loss function.
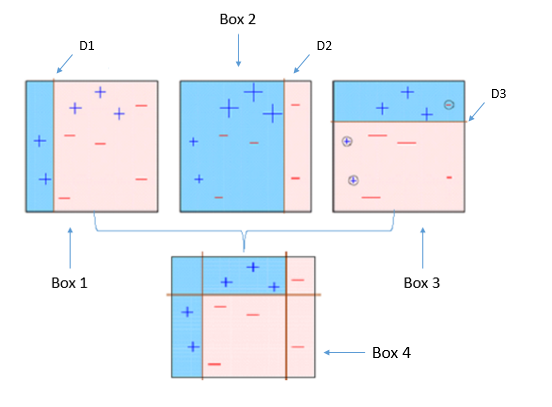
Boosting is a sequential process; i.e., trees are grown using the information from a previously grown tree one after the other. This process slowly learns from data and tries to improve its prediction in subsequent iterations. Let's look at a classic classification example:
Four classifiers (in 4 boxes), shown above, are trying hard to classify + and - classes as homogeneously as possible. Let's understand this picture well:
- Box 1: The first classifier creates a vertical line (split) at D1. It says anything to the left of D1 is + and anything to the right of D1 is -. However, this classifier misclassifies three + points.
- Box 2: The next classifier says don't worry I will correct your mistakes. Therefore, it gives more weight to the three + misclassified points (see bigger size of +) and creates a vertical line at D2. Again it says, anything to right of D2 is - and left is +. Still, it makes mistakes by incorrectly classifying three - points.
- Box 3: The next classifier continues to bestow support. Again, it gives more weight to the three - misclassified points and creates a horizontal line at D3. Still, this classifier fails to classify the points (in circle) correctly.
- Remember that each of these classifiers has a misclassification error associated with them.
- Boxes 1,2, and 3 are weak classifiers. These classifiers will now be used to create a strong classifier Box 4.
- Box 4: It is a weighted combination of the weak classifiers. As you can see, it does good job at classifying all the points correctly.
That's the basic idea behind boosting algorithms. The very next model capitalizes on the misclassification/error of previous model and tries to reduce it.
XGBoost in R
https://en.wikipedia.org/wiki/XGBoost
https://cran.r-project.org/web/packages/FeatureHashing/vignettes/SentimentAnalysis.html
https://xgboost.readthedocs.io/en/latest/R-package/xgboostPresentation.html
https://github.com/mammadhajili/tweet-sentiment-classification/blob/master/Report.pdf
https://datascienceplus.com/extreme-gradient-boosting-with-r/
https://www.analyticsvidhya.com/blog/2016/01/xgboost-algorithm-easy-steps/
https://www.r-bloggers.com/an-introduction-to-xgboost-r-package/
https://www.kaggle.com/rtatman/machine-learning-with-xgboost-in-r
https://rpubs.com/flyingdisc/practical-machine-learning-xgboost
https://www.youtube.com/watch?v=woVTNwRrFHE
Python for Data Science
R
RapidMiner

