Developing a Web Dashboard for analyzing Amazon's Laptop sales data
- Try the App at: http://gofaaaz.sinfronteras.ws (we just started doing some tests)
- An example of the data (JSON file) we have scraped from Amazon: Media:AmazonLaptopReviews.json (Open it with Firefox if you don't have a proper GoogleChrome plugin to visualize JSON files)
Contents
[hide]1 What do we want to build?
1.1 Goal
This project aim to develop a Data Dashboard for analyzing Laptop Customer Reviews from Amazon.
In a general sense, «a Data Dashboard is an information management tool that visually tracks, analyzes and displays key performance indicators (KPI), metrics and key data points to monitor the health of a business, department or specific process» [1]. That is not a bad definition to describe the application we want to build. We just need to highlight that our Dashboard is going to display information about Laptop sales data from Amazon (customer reviews, in particular).
We wanted to mentione that the initial proposal was to develop a Dashboard for analyzing a wider range of products from Amazon (not only Laptops). However, because we have limited HR and time to accomplish this project, we were forced to reduce the scope of the application. This way, we are trying to make sure that we count with enough time to develop a functional Dashboard with visual appeal and a decent web design.
Some examples of the kind of Application we want to build:
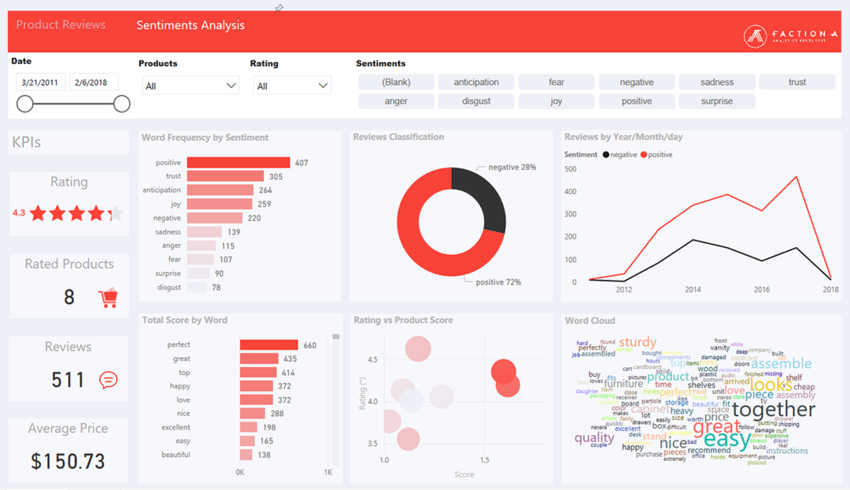
- Example 1: (Figure 1)
- Sentiment Analysis Dashboard: https://powerbi.microsoft.com/en-us/partner-showcase/faction-a-sentiment-analysis-dashboard/
- Demo video: https://www.youtube.com/watch?v=R5HkXyAUUII
- This is the most similar application to the one we want to build that we have found in our research. Our initial requirements and prototype will be based in some of the component shown in this application.
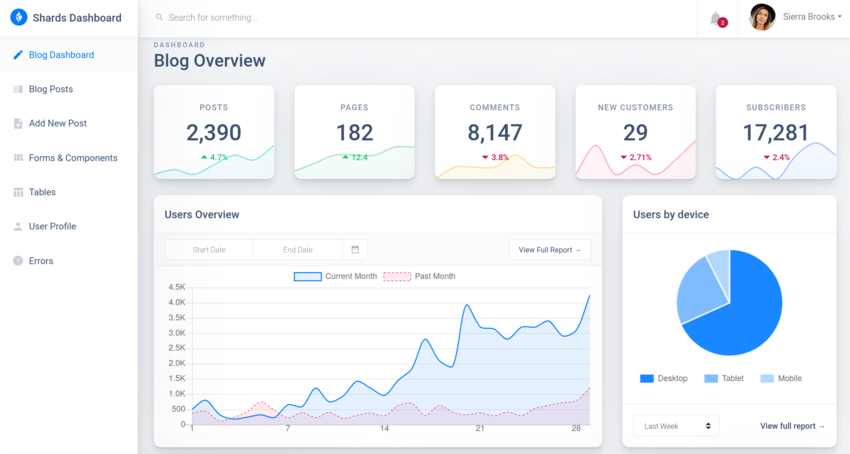
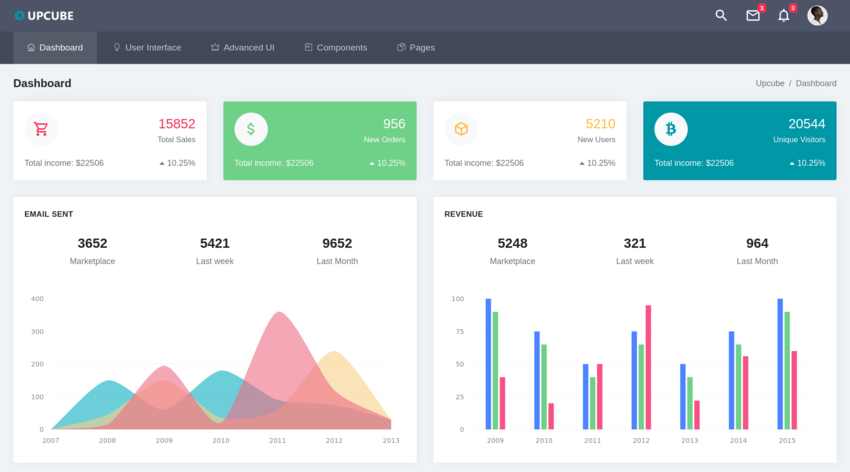
- Example 2: In Figure 4 and Figure 3 we show two other Dashboard. These ones don't have a similar function to the Dashboard we want to built. They are other purposes dashboards, but they are good examples of the design and visual appeal of the application we aim to build.
- https://designrevision.com/demo/shards-dashboard-lite-react/blog-overview
- https://themesdesign.in/upcube/layouts/horizontal/index.html
- Example 3: You can also try some Dashboard that have been developed with the same technologies that we are going to use (Python - Dash). We will talk a little more about this technologies later:

https://powerbi.microsoft.com/en-us/partner-showcase/faction-a-sentiment-analysis-dashboard/
https://www.youtube.com/watch?v=R5HkXyAUUII

https://designrevision.com/demo/shards-dashboard-lite-react/blog-overview

https://themesdesign.in/upcube/layouts/horizontal/index.html
2 Stage of development and technologies
Python is the main programming language that will be used in all stage of development. Some of the libraries:
- Pandas, NumPy, NLTK, Plotly, Cufflinks.
- Scrapy.
- Dash - Plotly.
- Why Python?
- Backend:
- Data Analytic:
- Natural language processing:
- Text pre-processing: Removing punctuation, Removing stopwords, Tokenization, etc.
- Sentiment Analysis.
- Text filtering.
- Technologies: Python. Some of the libraries: Pandas, NumPy, NLTK, Plotly, Cufflinks.
- Frontend:
- Layout design and development.
- Data visualization. We will use several kind of charts to visualize the data. E.g.:
- Word cloud: It will be used to visualize Word frequency in reviews.
- Bar chart: We will use this kind of charts to visualize data comparison (price comparison, average customer reviews comparison, Word frequency in reviews, etc.)
- Histogram.
- Pie Charts.
- Bubble plot.
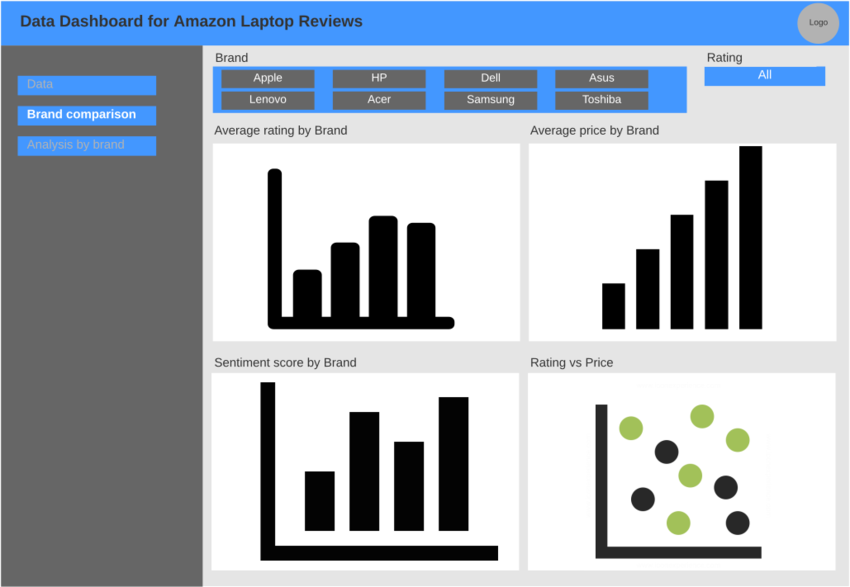
3 Wireframe

Built with https://www.lucidchart.com/[5]
Open Image in a new tab: Media:Dashboard wireframe.pdf
4 Requirements
Depending on the nature of the projects, the requirements of a software development strategy can be gathered using different methods:
- Questionnaires and Interviews: If there is a client or if we are in contact with the final users, methods like questionnaires and interviews with the client/users are usually carried out to determine requirements. In case of a client, initial requirements are usually provided by the client at the beginning of the project and redefined in every stage of the the development process as the client and developers identifies new ones. [6]
- Assessment of the current computer system: If there is a current system, this must be tested and evaluated to determine requirement of the new one. [6]
- Scenarios: «A scenario is a sequence of interactions between a user and the system carried out in order to satisfy a specified goal» [6]. This is a very popular method to determine requirements since it can be used when there is no a client, final users or current computer system.
In our case, we started building a list of requirements by analyzing similar current Dashboards and using Scenarios. This way, the first prototype of our Dashboard will be built based on some of the components of this Application: https://www.youtube.com/watch?v=R5HkXyAUUII
As we mentioned in Section 1, we based our first
5 Intended target market
A data analysis dashboard for sale strategy has a very wide target market. For any company that sales something, it would be beneficial to analyses data that allows them to understand the dynamic of the market THEY are targeting.
As we have already mentioned, we were forced to reduce the scope of this project because of the time that we have to accomplish it. So the final result will be a Web Dashboard for analyzing «Laptops» sale data from «Amazon» (Customer online reviews, in particular). However, we would like to invite you to think about this project as a methodology to build a Dashboard for analyzing online retailers sale data; regardless the target products or where the data is scraped from.
So, in the sense described above, we can say that our project can be applied across a whole range of sectors.
Now, let's be more specific about who can use our app. We will address three examples:
- Example 1: When explaining the concept of the project, we talked about the example of a computer manufacturer that is looking to enhance its sale strategy. That is an example for a very high business level. However, as we will see in the next example, this kind of analysis can also be beneficial for small business.
- Example 2: Think about a small computer retailer that is looking to enhance its sales. They also need information about the dynamic of the Laptop market: which are the top sellers, how much customers are willing to pay, which features are customers looking in a laptop, etc. This information will allow them to invest in the best marketing and sale strategy.
- Example 3:
6 References
- Jump up ↑ klipfolio.com, What is a data dashboard? https://www.klipfolio.com/resources/articles/what-is-data-dashboard
- Jump up ↑ Scrapy.org, Official Scrapy website, https://scrapy.org/
- Jump up ↑ Wikipedia.org, Scrapy, https://en.wikipedia.org/wiki/Scrapy
- Jump up ↑ datacamp.com, Dash for Beginners, https://www.datacamp.com/community/tutorials/learn-build-dash-python
- Jump up ↑ Create Charts & Diagrams Online, https://www.lucidchart.com
- ↑ Jump up to: 6.0 6.1 6.2 Carol Britton and Jill Doake, A Student Guide to Object-Oriented Development, 2005 , Elsevier.