Developing a Web Dashboard for analyzing Amazon's Laptop sales data
- Try the App at: http://gofaaaz.sinfronteras.ws
- An example of the data we have scraped from Amazon:
- A "Draft Chapter 1" of your Project (you could see this as an expanded version of your initial proposal). This should include:
- A clear explanation of your project concept (i.e. what are you doing);
- A clear explanation of the rationale for the project or the problem that your project aims to solve (i.e. why are you doing it);
- An outline of the sort of people / organizations who might be able to make use of your finished product (i.e. who are you doing it for);
- An outline of the various technologies that you will be using (i.e. what do you need to do it)
- A draft PLAN showing that you have considered the steps that you need to follow, with your estimate of how long each step will take (i.e. how will you do it). This means you will need to have considered the REQUIREMENTS of your project, at least in draft format.
Contents
1 What do we want to build
This project aim to develop a Data Dashboard for analyzing Laptop Customer Reviews from Amazon.
In a general sense, «a Data Dashboard is an information management tool that visually tracks, analyzes and displays key performance indicators (KPI), metrics and key data points to monitor the health of a business, department or specific process» [1]
That is not a bad definition to describe the application we want to build. We just need to highlight that our Dashboard is going to display information about Laptop sales data from Amazon (customer reviews, in particular).
We wanted to mentioned that the initial proposal was to develop a Dashboard for analyzing a wider range of products from Amazon (not only Laptops). However, because we have limited HR and time to accomplish this project, we were forced to reduce the scope of the application. This way, we are trying to make sure that we count with enough time to develop a functional Dashboard with visual appeal and a decent web design.
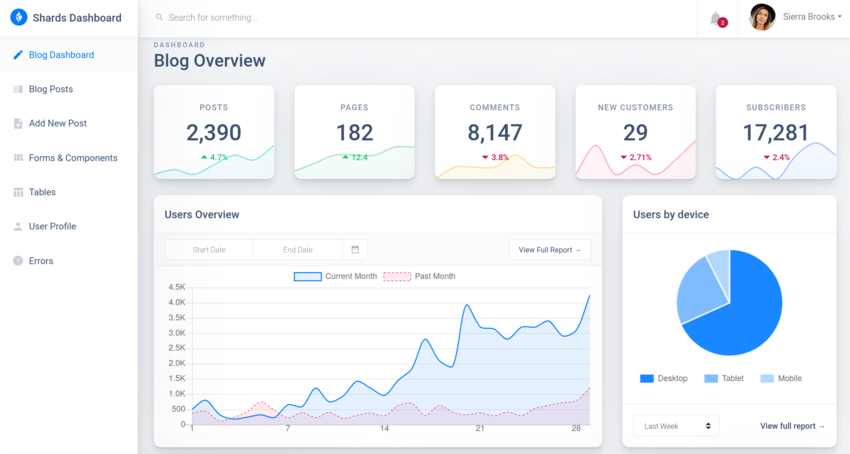
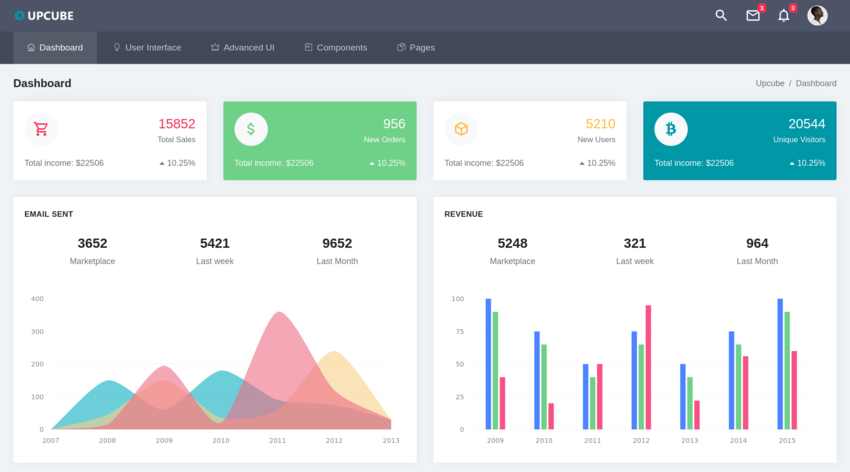
Some examples of the kind of Application we want to build:
- In Figure 1 and Figure 3 we show a good picture of the kind of Dashboard we are going to develop.
- We also invite you to watch this video that show a Sentiment Analysis Dashboard Demo, which is a very similar Dashboard to the one we wan to build: https://www.youtube.com/watch?v=R5HkXyAUUII
- You can also try some Dashboard that have been developed with the same technologies are we going to use (Python - Dash). We will talk a little more about this technologies later:


1.1 Stage of development and technologies
Python is the main programming language that will be used in all stage of development. Some of the libraries:
- Pandas, NumPy, NLTK, Plotly, Cufflinks.
- Scrapy.
- Dash - Plotly.
- Why Python?
- Backend:
- Data Analytic:
- Natural language processing:
- Text pre-processing: Removing punctuation, Removing stopwords, Tokenization, etc.
- Sentiment Analysis.
- Text filtering.
- Technologies: Python. Some of the libraries: Pandas, NumPy, NLTK, Plotly, Cufflinks.
- Frontend:
- Layout design and development.
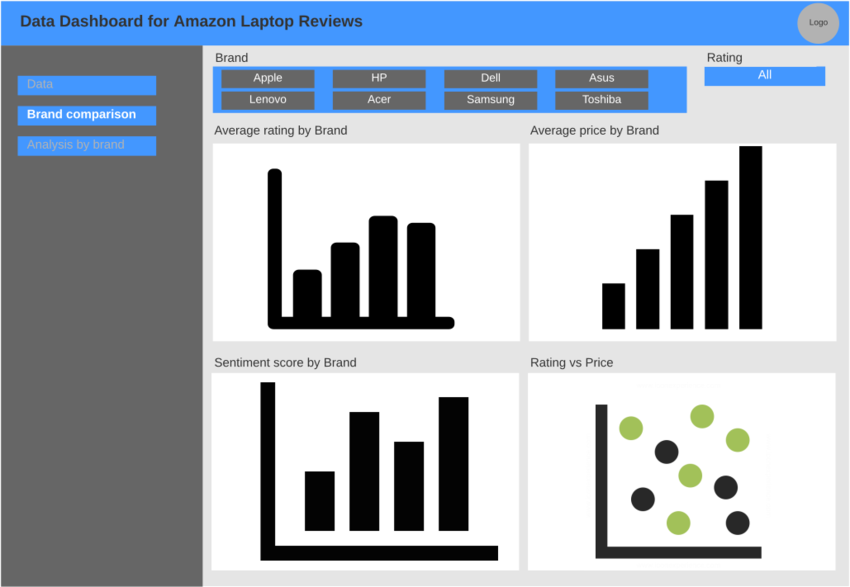
- Data visualization. We will use several kind of charts to visualize the data. E.g.:
- Word cloud: It will be used to visualize Word frequency in reviews.
- Bar chart: We will use this kind of charts to visualize data comparison (price comparison, average customer reviews comparison, Word frequency in reviews, etc.)
- Histogram.
- Pie Charts.
- Bubble plot.
1.2 Wireframe

2 Rationale and business value
In marketing and business intelligence, it is crucial to know what customers think about target products. Customer opinions, reviews or any data that reflect the experience of the customer, represents an important information that companies can use to enhances their marketing and business strategies.
Marketing and business intelligence professionals, also need a practical way to display and resume the most important aspects and key indicators about the dynamic of the target market; but, what we want to say when we refer to the dynamic of the market? Well! we are going to use this term to refer to the most important information that business professional require to understand the market and thus be able to make decision that seek to improve the revenue of the company.
Now, let's explain with a practical example, which kind of information business professionals need to know about a target product or market. Suppose that you are a Business Intelligence Manager working for an IT company (Lenovo, for example). The company is looking to improve its Laptops sale strategy. So!, which kind of information do you need to know, to be able to make key decisions related to the Tech Specs and features that the new generation of Laptops should have to become a more attractive product into the market? Well! you would need to analyses, for instance:
- Which are the best selling Laptops.
- Are Lenovo Laptos in a good position into the market?
- What are the top Lenovo Competitors in the industry.
- What are the key features that customers take into consideration when buying a Laptop.
- What are the key tech specs that customers like (and don't like) about Lenovo and Competitors Laptops.
- How much customers are willing to pay for a Laptop.
Those are just some examples of the information a business intelligence professional need to know when looking for the best strategy. Let's say that, after analyzing the data, you found that the top selling Laptops are actually the most expensive ones. Laptops with high quality tech specs and performance. You also found that Lenovo Laptops are, in general, under the range of prices and quality tech specs of the top selling Laptops.
With the above information, a logical strategy could be to invest in an action plan to improve the tech specs and general quality of Lenovo Laptops. If, on the contrary, the information highlights that very expensive Laptops have a very low demands, an intelligent approach could be a strategy to reduce costs of the new generation of Laptops.
So, we have already seen the importance of analyzing relevant data to understand the dynamic of the market when looking to enhance the business strategy. Now, from where and how can we get the necessary data to perform a market analysis for a business plan?
This kind of data can been collected by asking directly information from retailers. For example, if you have access to a detailed Annual Report for Sales & Marketing of a computer retailer, you will have the kind of information that can be valuable to understand the dynamic of the market. The report could contains details about the best selling computers, prices, tech specs, revenues, etc.
However, from a Sales Annual report, would be missing detailed information about what customer think of the product they bought. Traditionally, this kind of data has been collected using methods such as face to face or telephone surveys.
Recently, the huge amount of data generated every day in social network and online retailer, is being used to perform analysis that allow to gain a better understanding of the market and, in particular, about customer opinions.
Sentiment Analysts, is a method that uses natural language processing and text analysis thecniques to extract key indicators from text data. It is widely used in reviews and survey analysis.
3 Requirements
Depending on the nature of the projects, the requirements of a software development strategy can be gathered using different methods:
- Questionnaires and Interviews: If there is a client or if we are in contact with the final users, methods like questionnaires and interviews with the client/users are usually carried out to determine requirements. In case of a client, initial requirements are usually provided by the client at the beginning of the project and redefined in every stage of the the development process as the client and developers identifies new ones. [5]
- Assessment of the current computer system: If there is a current system, this must be tested and evaluated to determine requirement of the new one. [5]
- Scenarios: «A scenario is a sequence of interactions between a user and the system carried out in order to satisfy a specified goal» [5]. This is a very popular method to determine requirements since it can be used when there is no a client, final users or current computer system.
In our case, we started building a list of requirements by analyzing similar current Dashboards and using Scenarios. This way, the first prototype of our Dashboard will be built based on some of the components of this Application: https://www.youtube.com/watch?v=R5HkXyAUUII
As we mentioned in Section 1, we based our first
4 Intended target market
A data analysis dashboard for sale strategy has a very wide target market. For any company that sales something, it would be beneficial to analyses data that allows them to understand the dynamic of the market THEY are targeting.
As we have already mentioned, we were forced to reduce the scope of this project because of the time that we have to accomplish it. So the final result will be a Web Dashboard for analyzing «Laptops» sale data from «Amazon» (Customer online reviews, in particular). However, we would like to invite you to think about this project as a methodology to build a Dashboard for analyzing online retailers sale data; regardless the target products or where the data is scraped from.
So, in the sense described above, we can say that our project can be applied across a whole range of sectors.
Now, let's be more specific about who can use our app. We will address three examples:
- Example 1: When explaining the concept of the project, we talked about the example of a computer manufacturer that is looking to enhance its sale strategy. That is an example for a very high business level. However, as we will see in the next example, this kind of analysis can also be beneficial for small business.
- Example 2: Think about a small computer retailer that is looking to enhance its sales. They also need information about the dynamic of the Laptop market: which are the top sellers, how much customers are willing to pay, which features are customers looking in a laptop, etc. This information will allow them to invest in the best marketing and sale strategy.
- Example 3:
5 Porter's Five Forces analysis
Data Dashboard for Amazon Laptop Reviews#hola
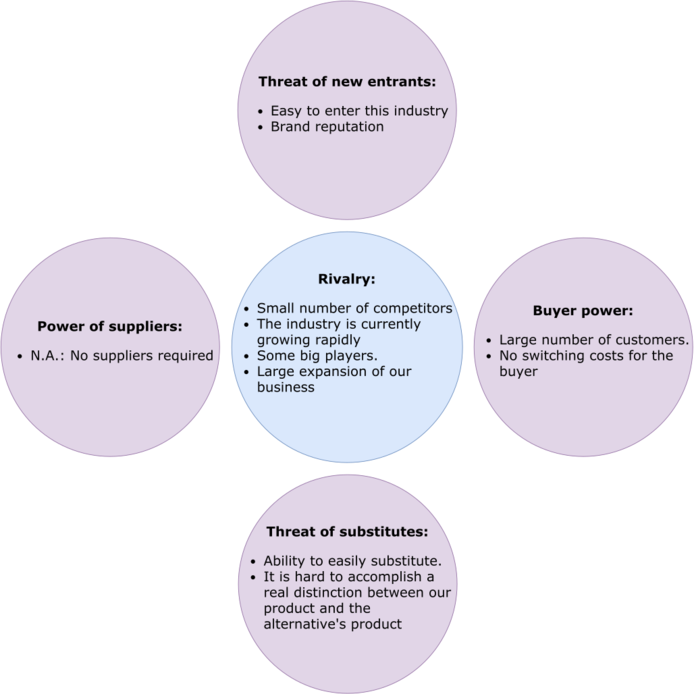
In Figure 4, we show the Poter's Five Forces Analysis. Let's explain some of the most important points included in this diagram to be able to reach logical conclusions.
- Rivalry:
- Even if we cannot say that Data analytic is a new field of study, it is true that it has gained growing importance in recent years. This growth has been driven mostly by the large amount of data generated every day on the Internet. That is why, even if there are already some big players and a NO small number of new companies investing in this sector, we think that there are still a lot of opportunities in this big market. Therefore, we are convinced that Rivalry is not the biggest threat. We actually think that it represent a small risk.
- We think the Rivalry context is POSITIVE for our project.
- Threat of new entrants:
- In this section, we think that the most important threat is the facility to enter in the industry. A company that is looking to enter this market, would have to invest mostly in HR. There are a lot of free technologies that can be implemented to start developing the project before is ready to be launched into the market.
- We think the Rivalry context is NEGATIVE for our project.
- Buyer power:
- Large number of customers: As we have already mentioned, for any company that sales something, it would be beneficial the use of this kind of Applications. So we can say that we have a wide target market. Also, because this sector is growing rapidly, we are convinced that there is a huge number of customers. This would of course reduce the threat of Buyer power.
- We also think that there would not be (or it would be really low) the switching costs for the buyer. Therefore, contrary to the previous point, this fact would increase the threat of Buyer power.
- We think the Rivalry context is NEUTRO for our project.
- Threat of substitutes:
- Ability to easily substitute: We think that our product is easy to replace. So this would be a clear threat. We have also taken into consideration, that it is hard to accomplish a real distinction with respect to a similar product. Therefore, we also see a big risk in this aspect.
- Power of suppliers:
- This aspect does not apply to our project. We would no need any particular supplier. This aspect does not apply to our project. We would no need any particular supplier. We just need some technologies that are very well known into the market and can actually be replaced for other ones.
- The only risk that we could see in this point is that some technology become deprecated after we have built the platform; but this would be a very unlikely scenario.
- We think the Rivalry context is POSITIVE for our project.
Some conclusions about the Porter's Five Forces analysis:
After analyzing the aspects that we consider most important for our project. We are convinced that the context presented by the Porter's analysis is positive for our project.
We think that the huge growth of the Data Analytic sector in the latest years, and most importantly, the grow expected for the next years is a fact that can, without any doubt, be used to gain Competitive Advantage. According to the U.S. Bureau of Labor Statistics, 11.5 million Data Science job will be created by 2026 [\cite{r:data_jobs}].
In the Porter's Five Forces analysis we saw that the mos important threat we identified was the Threat of new entrants. Any IT company could easily invest in this sector and would represent a big risk for in the market. However, we concluded that the other aspects of the Porter's Analysis are positive for our project. We specially think that the first inversion to start the project would not be so high and we don't need not count with any particular Supplier. We can start developing with a very high rage of free technologies.
6 References
- ↑ klipfolio.com, What is a data dashboard? https://www.klipfolio.com/resources/articles/what-is-data-dashboard
- ↑ Scrapy.org, Official Scrapy website, https://scrapy.org/
- ↑ Wikipedia.org, Scrapy, https://en.wikipedia.org/wiki/Scrapy
- ↑ datacamp.com, Dash for Beginners, https://www.datacamp.com/community/tutorials/learn-build-dash-python
- ↑ 5.0 5.1 5.2 Carol Britton and Jill Doake, A Student Guide to Object-Oriented Development, 2005 , Elsevier.
